Health & Fitness
Real Estate Market Snapshot: Presidents Neighborhood
Median sales price is up over the same period last year.
Welcome to my second post in a new series where I look at recent sales figures in a particular Novato neighborhood. Last Sunday was . This week it’s the Presidents neighborhood (and a bit beyond since there were too few sales in the past 90 days in the Presidents area alone.)
Presidents Neighborhood Overview
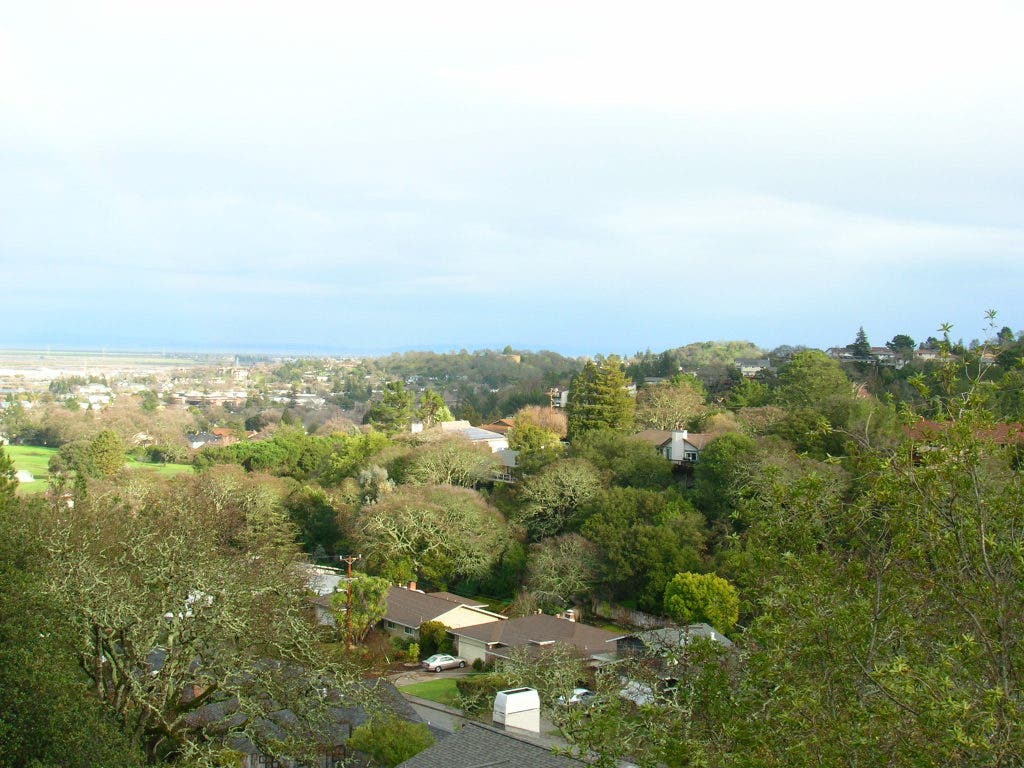
So-named because many of the streets bear the surnames of former U.S. presidents (Arthur, Washington, Truman, Buchanan, Van Buren, etc.) this neighborhood is located in the "mid-west" area of Novato. It's an established area with sidewalks, mature trees and rolling hills. The area is home to Novato High and Rancho Elementary schools as well as Arroyo Avichi Park.
Find out what's happening in Novatowith free, real-time updates from Patch.
The neighborhood has easy access to downtown, Highway 101 and the Vintage Oaks Shopping Center.
Market Information
Find out what's happening in Novatowith free, real-time updates from Patch.
(From BARIES MLS. All information below is deemed reliable but is not guaranteed.)
Information as of May 28, 2011 – Presidents Neighborhood + similar homes on adjacent streets (including areas like Monte Maria, southern Cambridge, Arlington, etc.)
Active listings: 9
Price range: $339,000-$999,000
Recent Sales (past 90 days, all single-family homes) ... Sorry for the wonky tables, hope for a solution soon :)
Address Bd/Ba Sq Ft Sales Price
1367 Monte Maria Ave. 3/2 1,278 $320,000
651 Midway Blvd. 3/2 1,654 $345,000
1523 Buchanan St. 3/2 1,686 $420,000
701 Arthur St. 3/2 1,301 $475,000
1210 Ridgeview Hgts. 3/2 1,352 $485,000
735 Arlington Cir. 5/3.5 2,724 $575,000
42 Terry Cir. 4/2 1,704 $629,000
Market Performance (February 28, 2011-May 28, 2011)
Sales Data Past 90 days Same period in 2010 Change
# of sales 7 7 none
Avg. sale price $464,143 $480,714 down 3.5%
Median sale price $475,000 $449,000 up 6%
Avg. size 1,688 1,580
Avg. price/sq ft $281 $284 down 1%
# bank or short sales 3 1 up 200%
Avg. days on market 116 29 up 300%
Highlights:
- Sales volume stayed the same compared to the same period last year
- The price per square foot stayed flat year-over-year
- Average time on market tripled, in part due to higher number of short sales which take much longer to close


